Comparing the Cost of Living Between Generations
This year, ConsumerAffairs released a report that analyzed key cost metrics — including housing, college tuition, gas and income — to reveal how the cost of living has changed since the 1970s.
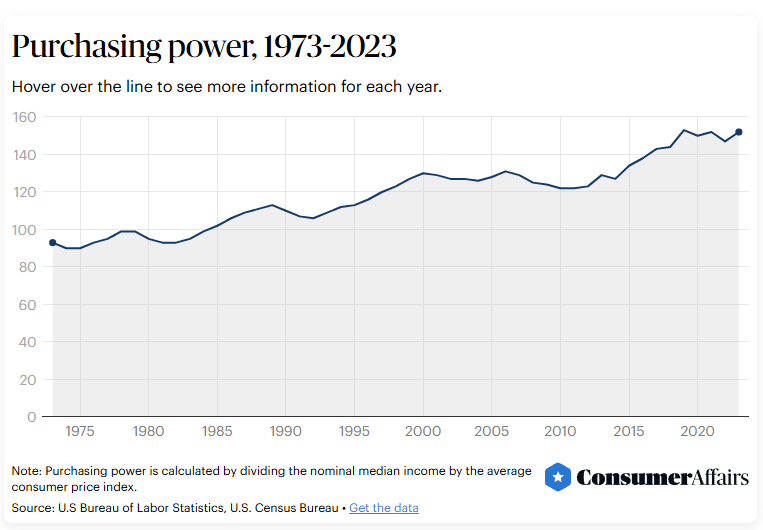
Purchasing Power
While it may not always feel like it, Americans today have more purchasing power than they did in the 1970s. Since 1973, the national median income has grown far faster than inflation. In 1973, the median income was $4,141. Today, it’s $46,190 — a 1,015% increase. Over the same period, the consumer price index (CPI), a common measure of inflation, has risen by 586%.
On paper, today’s dollar goes further, allowing more room for nonessential spending. But as the next section shows, the cost of essentials like housing and education has skyrocketed. These rising expenses have chipped away at the gains in purchasing power, which helps explain why many Americans still feel financially strained.
Housing Prices
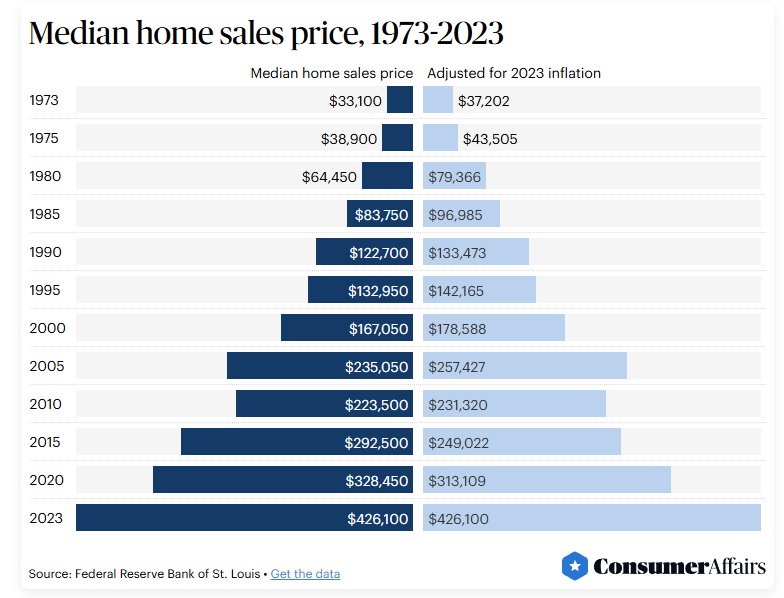
Perhaps the most dramatic difference between the cost of living in the 1970s compared with the 2020s is the cost of owning a home. About 69% of consumers say they are concerned about the cost of housing, Pew Research Center reported — not a surprise given that the median home sales prices have increased over 1,000% since the 1970s. While the 30-year fixed mortgage rate in 2023 was roughly the same as the mortgage rate in 1973, wages simply haven’t kept up with the price of housing, making it difficult for first-time homebuyers to break into the housing market and find a mortgage lender.
But even compared with a few years ago, home prices are significantly higher. “Price increases, coupled with interest rate hikes since 2019, mean buyers would pay approximately twice the monthly mortgage payment if they bought the same house today compared to five years ago,” said Michael Coon, an associate professor of economics at the University of Tampa. “Not to mention homeowners insurance premiums, which are up by over 23% since 2019.”
It’s not just the cost of buying a home that has increased since the 1970s; today’s renters also face a more expensive market, with rent increasing by 54% since the 1970s. With single-family homes more costly than ever to rent, those hoping to buy may not have as much left over after rent is due to save for a down payment.

College Tuition
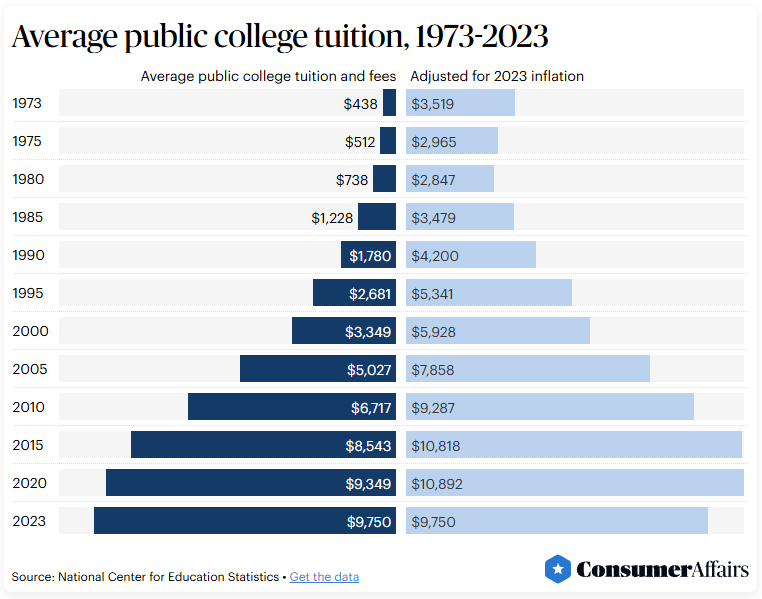
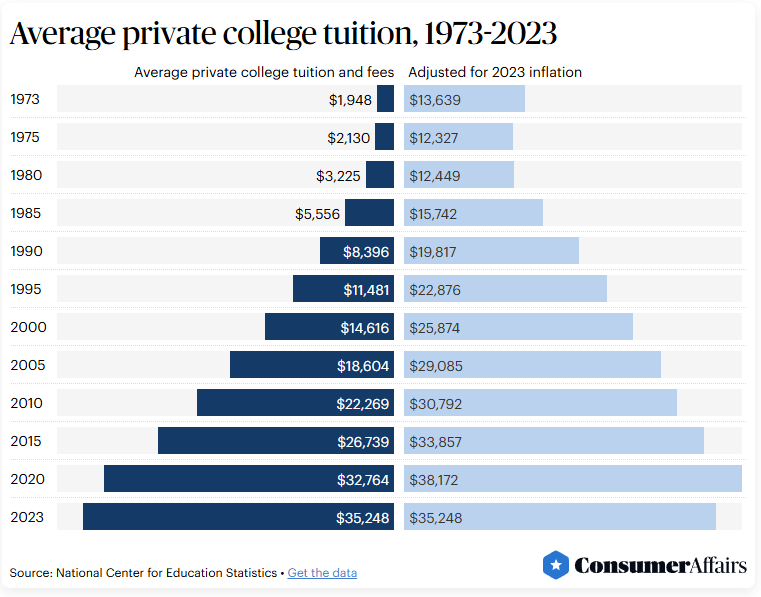
The cost of college tuition has also risen significantly since the 1970s. Baby boomers paid an inflation-adjusted average of $3,519 for tuition at a public college, compared to $9,750 in 2023 — a 177% increase. The cost of private college tuition has also risen by 158%, from $13,639 in 1973 to $35,248 five decades later.
Beyond that, student loans have further increased the financial burden of getting a higher education — the average student borrows over $30,000 to get a degree from a public university in 2025, according to EducationData.org.
Gas Prices
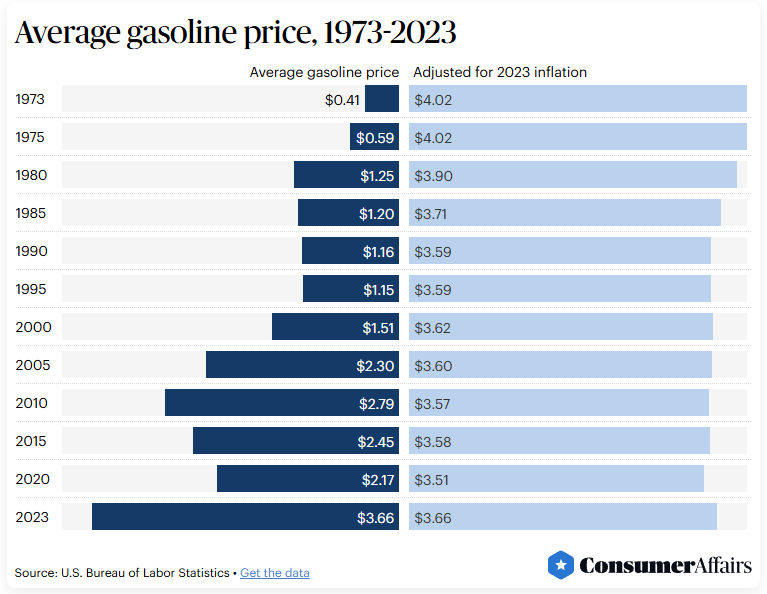
One surprising perk that Gen Z has over baby boomers in their 20s? The cost of gas. Inflation-adjusted gas prices actually decreased by 9% between 1973 and 2023. However, there is no clear downward trend in prices from 1973 onward. Adjusted for inflation, average gas prices have hovered between approximately $3.50 to $4.
Several factors impact the cost of gas, including disruptions to the crude oil supply or refinery operations. A notable example of supply disruption is the oil crisis of 1973 to 1974. After the U.S. provided emergency aid to Israel during the Yom Kippur War, the Organization of Arab Petroleum Exporting Countries retaliated by halting oil exports to the U.S.
Although the embargo ended in 1974, inflation-adjusted gas prices remained above $4 until 1978. Baby boomers may remember the long lines at gas stations and state-mandated rationing caused by the oil crisis — a hardship younger generations haven’t had to endure.
While Gen Z has more purchasing power than baby boomers did in their 20s, today’s young adults face a host of financial challenges — particularly when it comes to essentials like housing and education. The dollar may stretch further than it did in the 1970s, but the rising cost of necessities has made it harder for many to get ahead.
True Cost of Living
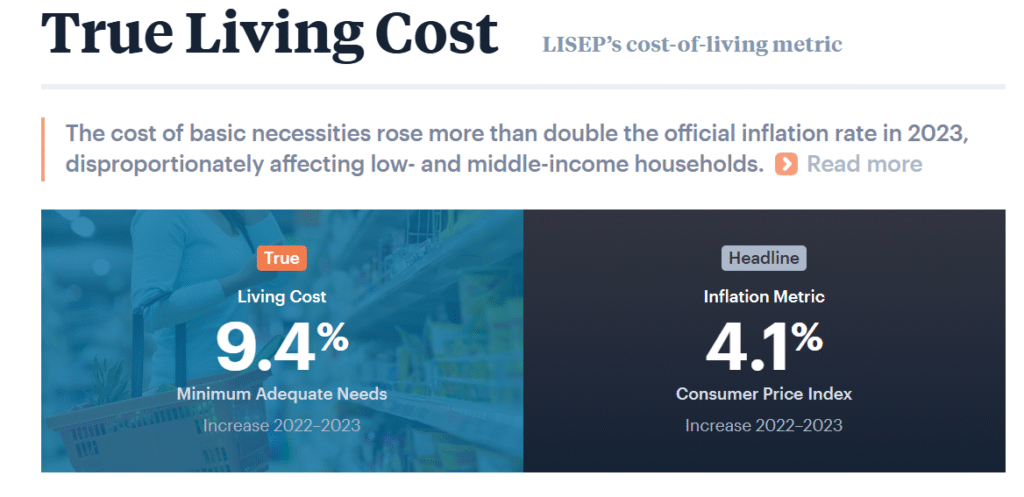
Inflation disproportionately affected low- and middle-income (LMI) households in 2023, with the cost of basic necessities rising more than double the official inflation rate, according to a new study by the Ludwig Institute for Shared Economic Prosperity (LISEP).
LISEP today issued data for its 2023 True Living Cost (TLC) Index, a cost-of-living metric tracking the change in prices for essential items and services needed to maintain a basic standard of living. The TLC shows a 9.4% increase in the cost of basic needs in 2023—more than double the 4.1% reported by the Consumer Price Index for All Urban Consumers (CPI).
Unlike the CPI, the TLC focuses on the essential expenses consuming the budgets of most American households: housing, food, healthcare, childcare, transportation, basic technology, and apparel, personal care and household items. By contrast, the CPI focuses on a diverse basket of more than 80,000 items, including items such as rental cars, second homes, and hotel rooms, that are less representative of the day-to-day household costs LMI Americans routinely face.
Ludwig noted that 2023 marked the highest annual TLC increase since 2001. The CPI rose 72.1% over this period, compared to 97.4% for the TLC. In addition, 2023 median weekly earnings for full-time workers as reported by the U.S. Bureau of Labor Statistics rose 5.4% before adjusting for inflation. However, when adjusted using the TLC, earnings fell 3.6%, compared to an increase of 1.3% when adjusted using the CPI.
The primary drivers of the TLC increase were significant price spikes in housing, transportation, healthcare, and food, led by an 11.4% increase in housing costs—the largest annual increase on record. Transportation costs rose 14.7% despite lower gasoline prices, due to higher insurance and financing costs. Health insurance premiums increased 7.9%, and food costs rose 4.4%.
“Middle- and working-class Americans are facing a growing economic crisis, struggling to make ends meet despite recent economic growth,” Ludwig said. “The rising cost of living, when combined with stagnant wages and a shortage of living-wage employment, is creating a perfect storm that threatens social and economic stability. Ignoring the LMI plight is a dangerous gamble.”
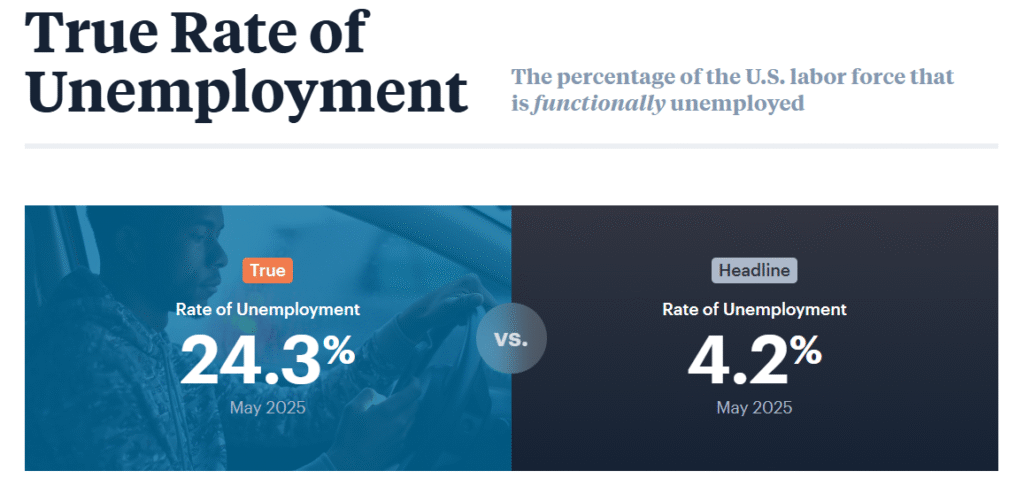
True Unemployment Rate
Using data compiled by the federal government’s Bureau of Labor Statistics, the True Rate of Unemployment tracks the percentage of the U.S. labor force that does not have a full-time job (35+ hours a week) but wants one, has no job, or does not earn a living wage, conservatively pegged at $25,000 annually before taxes.
Just as an accurate census is a prerequisite to funding American communities equitably, policymakers depend on economic indicators to shape economic policy. LISEP developed the True Rate of Unemployment to provide analysts and decision-makers with a more accurate measure of Americans’ financial well-being.
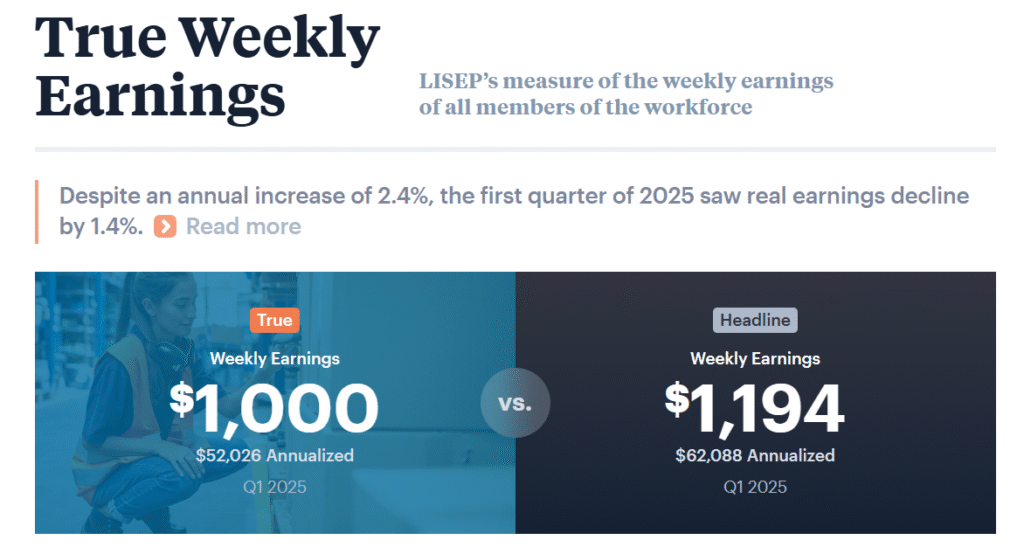
True Weekly Earnings
Using data compiled by the Bureau of Labor Statistics (BLS), LISEP calculated the median earnings of everyone who is employed or actively seeking employment. Thus, they took the median earnings of the whole U.S. labor force as defined by the BLS.
By comparison, the BLS headline numbers only include those who are employed at full-time jobs. If a low-income worker moves from full time to part time, or becomes unemployed, the BLS metric will report that earnings have risen, giving a false sense that earnings are getting better. TWE, on the other hand, gives policymakers access to a more comprehensive indicator of how the job market is performing as a whole.
Note: Both LISEP and BLS exclude the self-employed from their sample for measurement reasons.
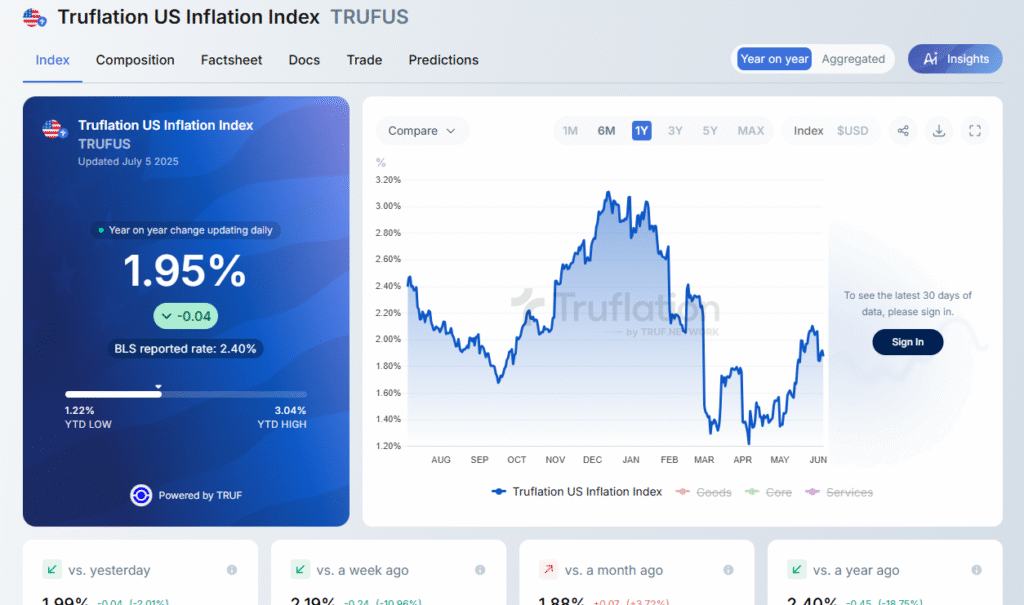
Real Inflation Rate
The Truflation Inflation Index tracks daily changes in consumer prices across the U.S. economy and currently stands at 1.99% as of July 4, 2025, reflecting a stable trend in recent weeks. The index is designed to provide a real-time, data-driven snapshot of inflation by aggregating millions of price points from diverse sources, offering a more immediate view than traditional government statistics.
- https://www.consumeraffairs.com/finance/comparing-the-costs-of-generations.html
- https://www.lisep.org/tlc
- https://www.lisep.org/tru
- https://www.lisep.org/twe
- https://truflation.com/marketplace/us-inflation-rate

- Mainstream Media Lies About America’s Economy - July 4, 2025
- Never Forget: The Sandy Hook Hoax - November 1, 2022
- Was the Diary of Anne Frank Just Another Jewish Lie? - October 29, 2022